

What buyers actually paid, from the county’s own books: every full-value home sale recorded in Sonoma County from April 2025–April 2026 — 3,629 of them — by the square foot, the bedroom, the price band, and the pool. Aggregates only; the Wag does not print who bought what. (The assessor’s roll runs months behind the market, so this ledger ends where the record is still solid — see the method note below.)
What a square foot cost
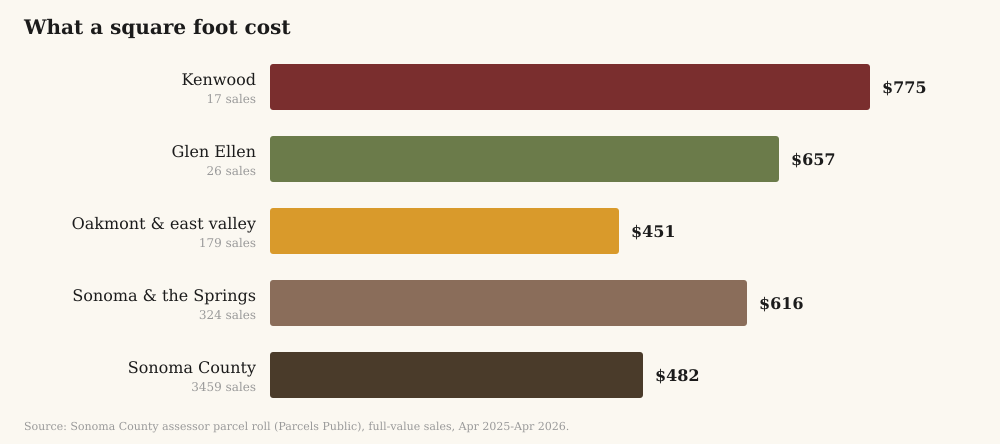
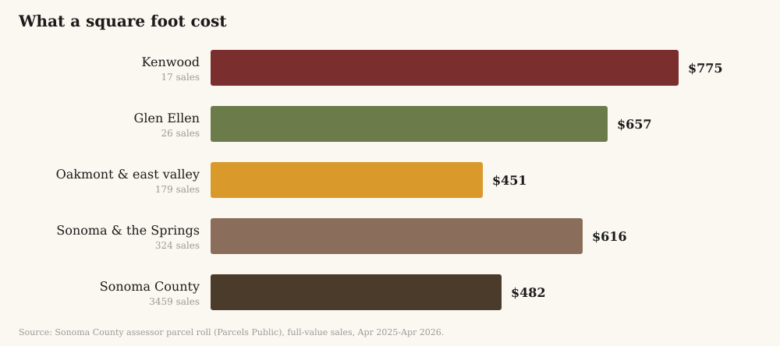
The chart medians are per area; the sale counts are printed on each bar, and a dozen sales is a dozen stories, not a statistic. Note the composition before comparing: most of the upper valley’s volume is Oakmont (179 of 222 sales in our three areas), whose smaller single-story homes trade below the county’s $482 median — while Kenwood and Glen Ellen, on thin volume, trade well above it.
What a bedroom count sold for
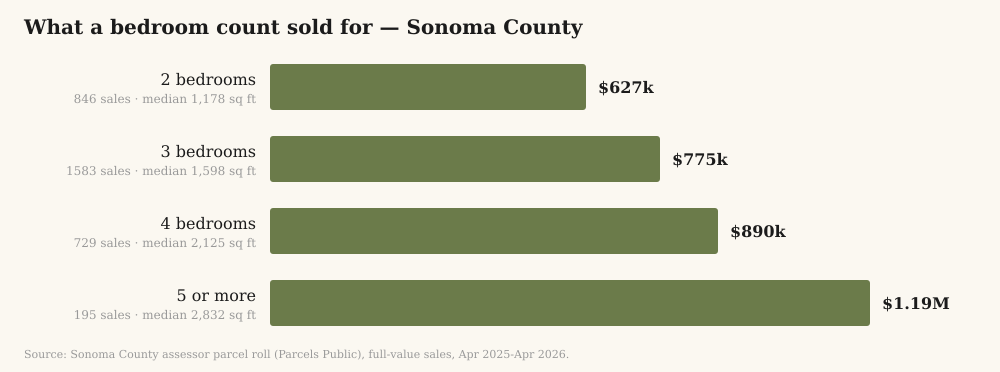
Countywide, the median three-bedroom sold for $775k and the median four-bedroom for $890k. Resist the subtraction: the median four-bedroom is also 527 square feet bigger (2,125 vs 1,598), so the gap prices the extra house, not the extra door. These are honest medians of what sold, not the price of a bedroom.
Where the market cleared
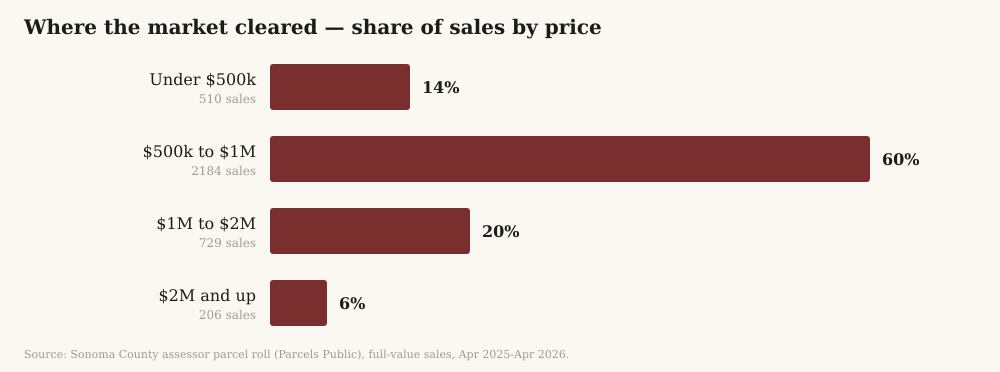
74% of the county’s sales closed under $1M, and 6% at $2M or more. The upper valley’s own median was $790k across 238 sales — Oakmont’s volume again doing most of the talking.
The vineyard trade
29 vineyard properties changed hands countywide in the window — median 10 acres, median price $1.80M. We don’t quote a per-acre figure: 23 of the 29 carried houses or winery buildings, so any such number would price the improvements, not the land. (Bare-land vineyard values are a licensed-appraisal world; the county’s books can’t honestly get you there.)
The pool question
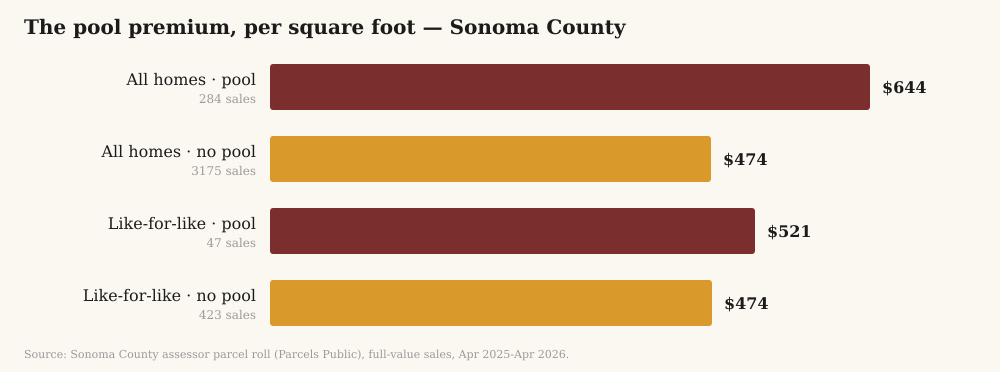
Homes with a pool sold for a median $1.49M against $750k without — but that flatters the pool, which tends to come attached to a bigger house on more land (median 2,380 sq ft on 0.46 acres, versus 1,584 on 0.16). Per square foot the raw gap is +36%. Compare like with like — three-bedroom homes of 1,500–2,800 sq ft on a tenth to a full acre — and it narrows to about +10%. Treat that as a ceiling, not a price: even inside the matched band the pool homes run bigger (1,961 vs 1,790 sq ft), so some of the residue is still house. In the valley’s own sales, 21 of 238 homes (9%) had one; the roll records permitted, assessed pools, so bootleg ones escape this arithmetic.
How we did this
Figures are computed from Sonoma County’s public assessor parcel roll (the Clerk-Recorder-Assessor’s “Parcels Public” data), which records each parcel’s most recent sale. We keep only full-value, single-parcel residential transfers of at least $100,000 — the deals that look like a home changing hands at market price — and we publish medians, never individual homes. The window ends April 2026 because the roll runs months behind the market: later months exist in the data but carry a small fraction of their eventual sales (the 5 months we dropped held just 165 recordings between them), and reporting them as complete would mislead. “Oakmont & east valley” is the eastern arm of Santa Rosa along Highway 12. The roll is maintained for taxation, not journalism; treat these as honest estimates, not appraisals.
Data: County of Sonoma open GIS data, used with attribution. Companion to our monthly housing-market report.
Correction & method note (September 24, 2026): an earlier version of this ledger styled itself “unit economics” and charted a price per acre by lot size — a figure that divides house-and-land prices by lot acreage and therefore prices houses, not land ($5M-plus “acres” on small lots). It also priced “the fourth bedroom” by subtracting confounded medians, and dated its window by a month the county’s records had barely begun to fill. All four habits are gone; the charts above are descriptive medians with their sample sizes printed on them.