

The valley’s housing market, taken monthly: what homes are worth, what’s selling, and how hard the bidding is — all from public data.
The short of it
- The median Sonoma County home sold for $792,473 in May 2026, little changed on a year earlier.
- 1,347 homes were on the market in June 2026 — about 2.9 months of supply at the current sales pace.
- 42% of May 2026’s sales closed over the asking price, and the typical home went pending in 16 days.
- The 30-year mortgage averages 6.69%, from 6.56% a year earlier.
What homes are worth
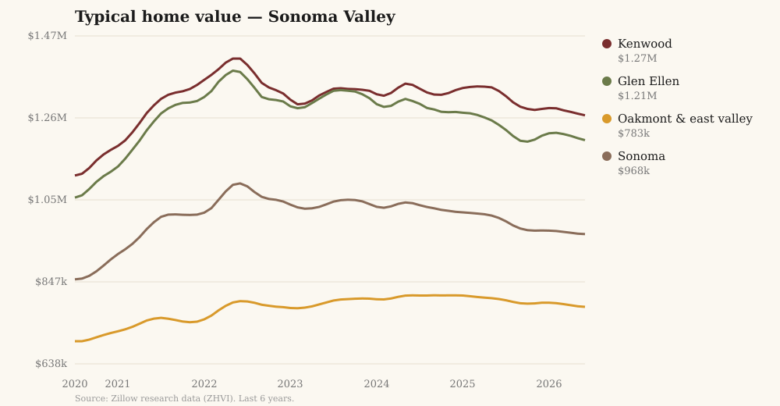
- Kenwood: $1.27M typical home value (▼ -4.6% year on year)
- Glen Ellen: $1.21M typical home value (▼ -3.1% year on year)
- Oakmont & east valley: $783k typical home value (▼ -2.5% year on year)
- Sonoma: $968k typical home value (▼ -4.1% year on year)
Figures are Zillow’s typical-home-value index for each ZIP code, as of June 2026. They estimate the middle of each town’s market — not any particular sale.
What's selling
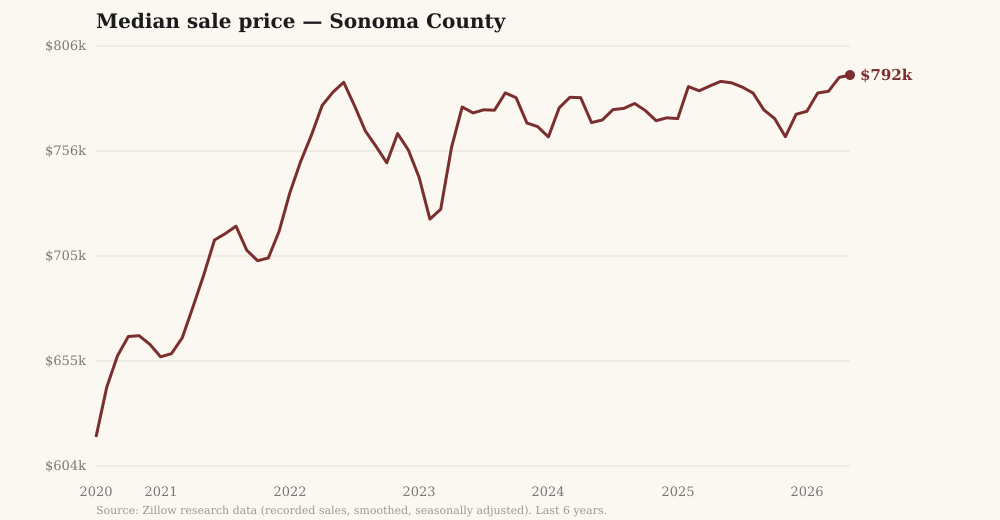
Across Sonoma County, the median home sold for $792,473 in May 2026 — essentially flat from a year earlier. Roughly 469 homes changed hands in June 2026, about even on the same month last year. Medians ebb with the seasons — they typically crest in spring and early summer, so a month’s move means less than the year’s. Kenwood and Glen Ellen are too small for reliable month-to-month sale figures on their own — too few homes change hands there for even aggregate ZIP-level sale medians to be published — so the county is the steadiest gauge of where prices are landing.
The supply of homes
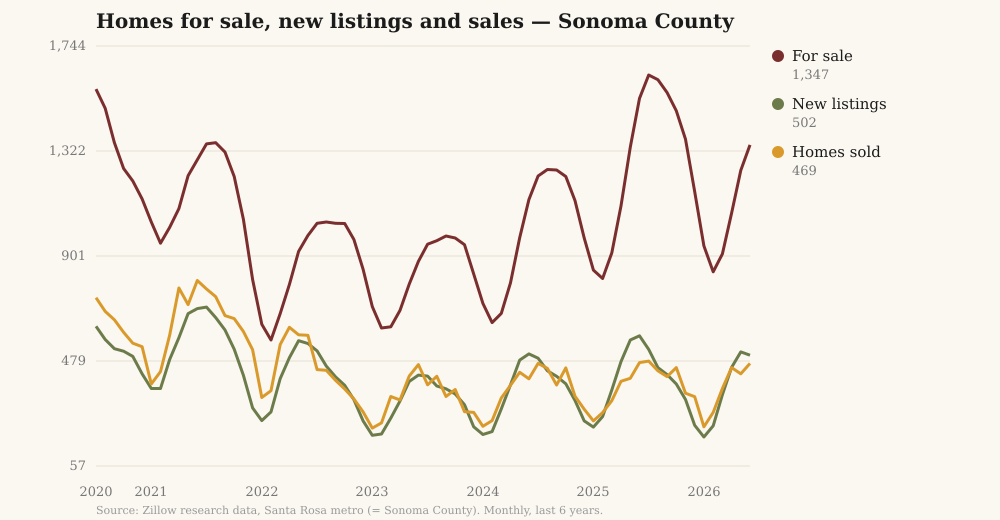
1,347 homes were for sale countywide in June 2026, down 12% on a year earlier. Sellers brought 502 fresh listings to market. At the current sales pace that inventory would clear in about 2.9 months — by the usual rule of thumb, a market that still leans toward sellers.
How the bidding is going
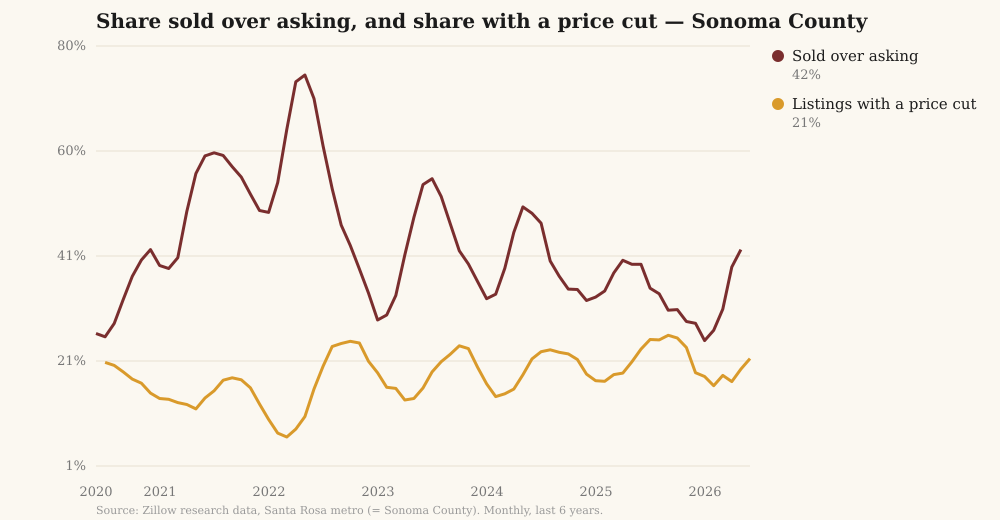
In May 2026, 42% of Sonoma County sales closed above the asking price (39% a year earlier). The median sale landed at 100.0% of list. The typical home that sold went pending in 16 days. On the other side of the ledger, 21% of active listings took a price cut in June 2026 — the clearest sign of sellers meeting the market.
The cost of money
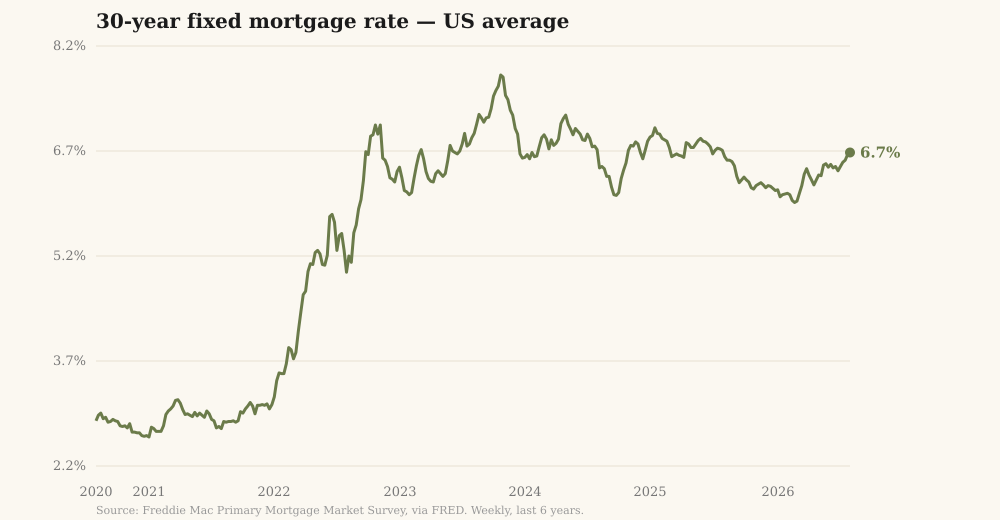
The average 30-year fixed mortgage stood at 6.69% in the week of August 2026, against 6.56% a year earlier. Rates set the budget for most buyers, and the valley’s market moves with them — slowly, then all at once.
A note on individual sales
We track market values and countywide sale trends from public data. Individual sale records — who bought which house, and for how much — are public too: the county’s assessor parcel roll records each parcel’s most recent sale, and our companion ledger, “What buyers paid,” reads it for the market’s broad shape — price per square foot by area, what each bedroom count sold for, the price-band mix, and the pool premium (with its confounds stated). What the Wag does not do is print the addresses and prices of particular homes; in a valley this small that is a deliberate editorial choice, not a data limitation.
County-wide figures use Zillow’s Santa Rosa metro series; the metro consists of Sonoma County alone, so the two are the same. Data from Zillow’s public research data (used with attribution) and Freddie Mac’s Primary Mortgage Market Survey via FRED. Indexes and medians are estimates, not appraisals; recent months are preliminary and may be revised. Longer-term trends mean more than any single month’s move. This page is assembled automatically from those sources each month.